Keywords: GIS, US 2020 election, accessing election data, utilizing election data,democratic
The availability and utilization of GIS data have revolutionized the way we analyze and understand the US 2020 election. By leveraging geospatial information, researchers, policymakers, and campaign strategists can gain valuable insights into voter behavior, electoral patterns, and demographic trends. Accessing and effectively utilizing GIS data is essential for informed decision-making, promoting transparency, and shaping the future of elections. With advancements in technology and data analysis techniques, the potential of GIS data in future elections is boundless. By harnessing the power of GIS data, we can unlock new possibilities and ensure the integrity and inclusivity of democratic processes.
This comprehensive guide aims to explore the process of accessing and effectively utilizing GIS data related to the US 2020 election.
- Understanding GIS Data and its Importance in the US 2020 Election:
- What is GIS data and how does it relate to the US 2020 election?
- The significance of geospatial data in electoral analysis.
- How GIS data enhances decision-making processes in politics and governance.
As a GIS enthusiast interested in exploring the US 2020 election data and creating real-time GIS election maps, I came across some impressive visualizations that caught my attention. Regardless of whether you follow politics closely or not, you've probably come across such information at some point. As a self-proclaimed GISer who tends to stray from my actual responsibilities, I found myself drawn to these maps created by various media outlets. Here are a few notable visualizations that caught my eye:
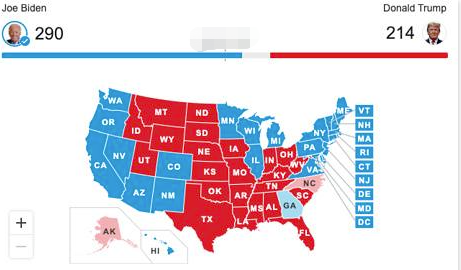
Google:
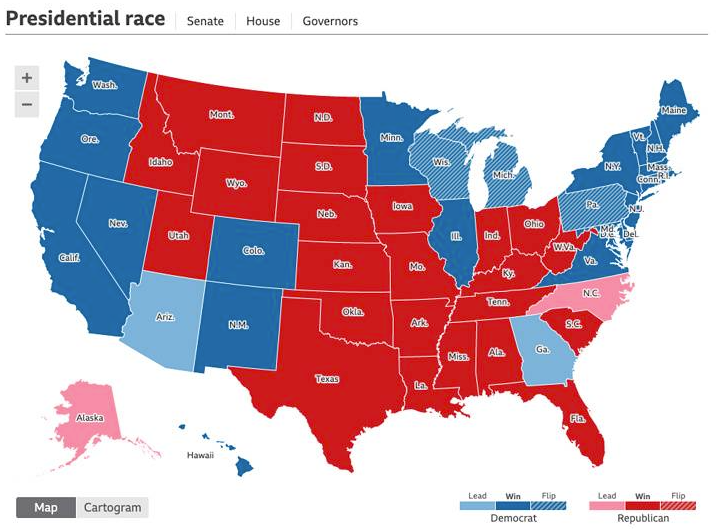
BBC:
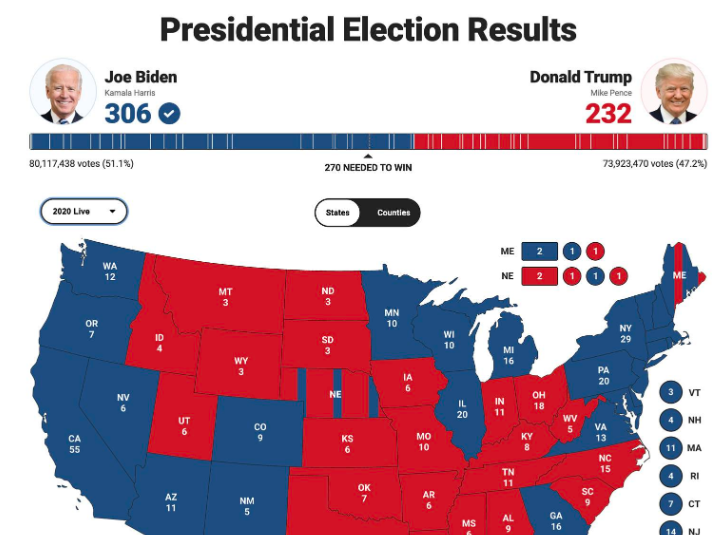
CNN:

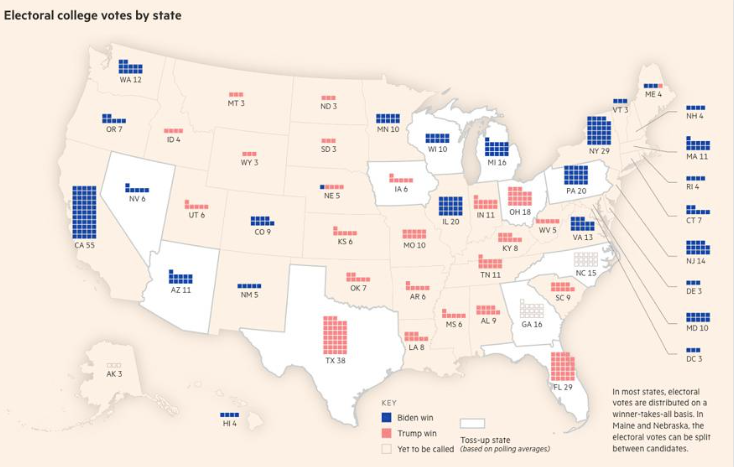
FT:
NYT:

Seeing these beautifully crafted visualizations got me thinking: Can we create similarly stunning maps ourselves? I wasn't sure, but I wanted to give it a try and obtain the necessary data. After some searching, I found a few websites where you can access election data. Let me recommend them to you:
- Kaggle: On Kaggle, someone has already shared the US 2020 election data, so you won't need to write a web scraper yourself. Plus, the data is regularly updated. You can find the data here: https://www.kaggle.com/unanimad/us-election-2020
- GitHub: There's a dataset called "us_elections_2020_csv" available on GitHub. The data is in CSV format and is continuously updated. You can access it here: https://github.com/kjhealy/us_elections_2020_csv
- USElection2020-NYT-Results: This project, also hosted on GitHub, provides data that covers multiple time periods. It's particularly useful for dynamic comparisons and analysis. You can find it here: https://github.com/favstats/USElection2020-NYT-Results
Now that we have the data, the possibilities are endless. However, I must admit that creating visually appealing maps requires not only technical skills but also a touch of artistic flair. Unfortunately, I lack the latter. But don't let that discourage you! With the right tools and some creativity, you can bring the data to life and create captivating visualizations that help you better understand the US 2020 election dynamics. So go ahead and dive into the world of GIS mapping, and who knows, you might uncover new insights and present them in a visually stunning manner.
Now that we have the data, the next step is data processing, which requires the use of GIS software. As mentioned in our previous article (referenced here: https://upgis.com/index.php/2019/07/04/10-best-gis-software), ArcGIS is the most professional and widely used GIS software.And How to buy it https://upgis.com/index.php/2020/06/12/arcgis-desktop%ef%bc%8carcgis-pro/ However, I'd like to introduce an alternative method that is suitable for GIS web development, quick mapping, and real-time updates of GIS data. The best part is, it's free!
Introducing ECharts - a powerful JavaScript library for data visualization. ECharts provides a user-friendly interface for creating interactive and visually appealing GIS maps. To use ECharts for 3D visualization, you'll need to include the echarts-gl.js library.
Please note that ECharts relies on WebGL, which cannot be directly rendered locally. You'll need to run it on a server. You can set up a local server for debugging purposes.
First, let's import the necessary dependencies into the HTML file's head section:
<script type="text/javascript" src="./lib/5.0.1/echarts.js"></script>
<script type="text/javascript" src="./lib/echarts-gl.js"></script>
Next, prepare a <div> element in advance to hold the map:
<div id="allmap"></div>
Now, let's move on to the code. Please note that the code can vary depending on your specific needs. Here's an example:
var myChart = echarts.init(document.getElementById("allmap"));

// Assuming you have your election data in the following format:
var electionData = [
  { state: "Alabama", electoralVotes: 9, party: "Republican" },
  { state: "Alaska", electoralVotes: 3, party: "Republican" },
  { state: "Arizona", electoralVotes: 11, party: "Democrat" },
  // Add more state data here...
];

var data = electionData.map(function (item) {
  return {
    name: item.state,
    value: item.electoralVotes,
    party: item.party,
  };
});

myChart.setOption({
  tooltip: {
    formatter: function (params) {
      return (
        params.name +
        "<br/>Electoral Votes: " +
        params.value +
        "<br/>Party: " +
        params.data.party
      );
    },
  },
  visualMap: {
    min: 0,
    max: 55, // Adjust the range according to the maximum number of electoral votes
    calculable: true,
    inRange: {
      color: ["#f9d6bc", "#c12e34"], // Adjust the color scheme as desired
    },
  },
  series: [
    {
      type: "map",
      map: "USA",
      roam: true,
      label: {
        show: true,
        fontSize: 10,
      },
      data: data,
    },
  ],
});
In this example, we assume you have an HTML element with the id "allmap" where the map will be rendered. The election data is provided in the electionData array, which contains objects with properties such as the state name, number of electoral votes, and party. Adjust the max value in the visualMap section according to the maximum number of electoral votes among all states. The color scheme can also be adjusted as desired.
The result is shown in the following image:
